PlantView® Reliability Index Download Brochure

 An Equipment Reliability Index (ERI) is a group
of performance indicators that enable management to understand the past equipment
reliability of a facility and provide indication and insight into expected future
equipment reliability. The goal of an ERI is to increase transparency of tasks and
actions that influence equipment reliability.
An Equipment Reliability Index (ERI) is a group
of performance indicators that enable management to understand the past equipment
reliability of a facility and provide indication and insight into expected future
equipment reliability. The goal of an ERI is to increase transparency of tasks and
actions that influence equipment reliability.
An ERI involves defining key plant process areas that must work effectively—such as work management, maintenance effectiveness and operational challenges—and then identifying indicators that assess and score the effectiveness of each process area. The ERI can be used to measure performance at one facility or across an entire fleet through a common set of indicators.
PlantView Reliability Index Module (RIM) implements the concept of an Equipment Reliability Index with a complete, user-configurable solution. PlantView/RIM replaces manual spreadsheets and monthly reports with a continuously updating ERI. On a periodic basis, the Reliability Index Module queries various databases to collect data for established indicators. Using predefined calculation rules, each of these indicators is assigned a score and an associated condition. Each indicator contributes towards a possible 100-point total Reliability Index Score based on a configurable weighting criterion. Drill-down capabilities highlight the underlying issues behind the indicators and allow for investigation and insight. Visual displays such as trends, bar charts and spider charts compare performance over time or between cohort facilities and units.
Benefits
Features
- Stores all information in a centralized, structured Oracle database.
- Data is captured and stored locally for long term trending and historical analysis.
- User configurable indicators and scoring rules.
- Detailed single facility displays; abbreviated multi-facility displays allow for quick comparisons.
- Trends show single indicator performance for score card; single/multi-facility comparisons.
- Spider Charts summarize multiple indicators and allow for multi-facility comparisons.
- Histograms count indicators by evaluated condition, allowing easy identification of problems.
- Templated approach ensures consistency between facilities and speeds implementation.
- Creates and implements different templates for different unit types (e.g. steam vs. combustion turbines) or other classifications (e.g. base load vs. reserve units) to ensure valid comparisons are made.
- Template definitions and scoring criteria are available for review on reported results.
Design & Configuration Process
The design process begins with the definition of the RIM indicators that will be used to compare equipment/facilities. The ERI is categorized into two types of indicators, leading or lagging. Leading indicators measure performance in areas that, if managed effectively, will predict and prevent more consequential issues. Lagging indicators measure consequential issues after they’ve occurred such as critical component failures. For each indicator, it is necessary to identify what will be measured, where the information resides, when the information will be captured and how the score will be evaluated. Values in the RIM grid display support a drill-down feature that is accessed by selecting menu choices from a rightclick context menu of listings, counts, trends or URLs. This capability allows the end-user to perform a deep-dive into the data as decisions are made based on values within the grid.
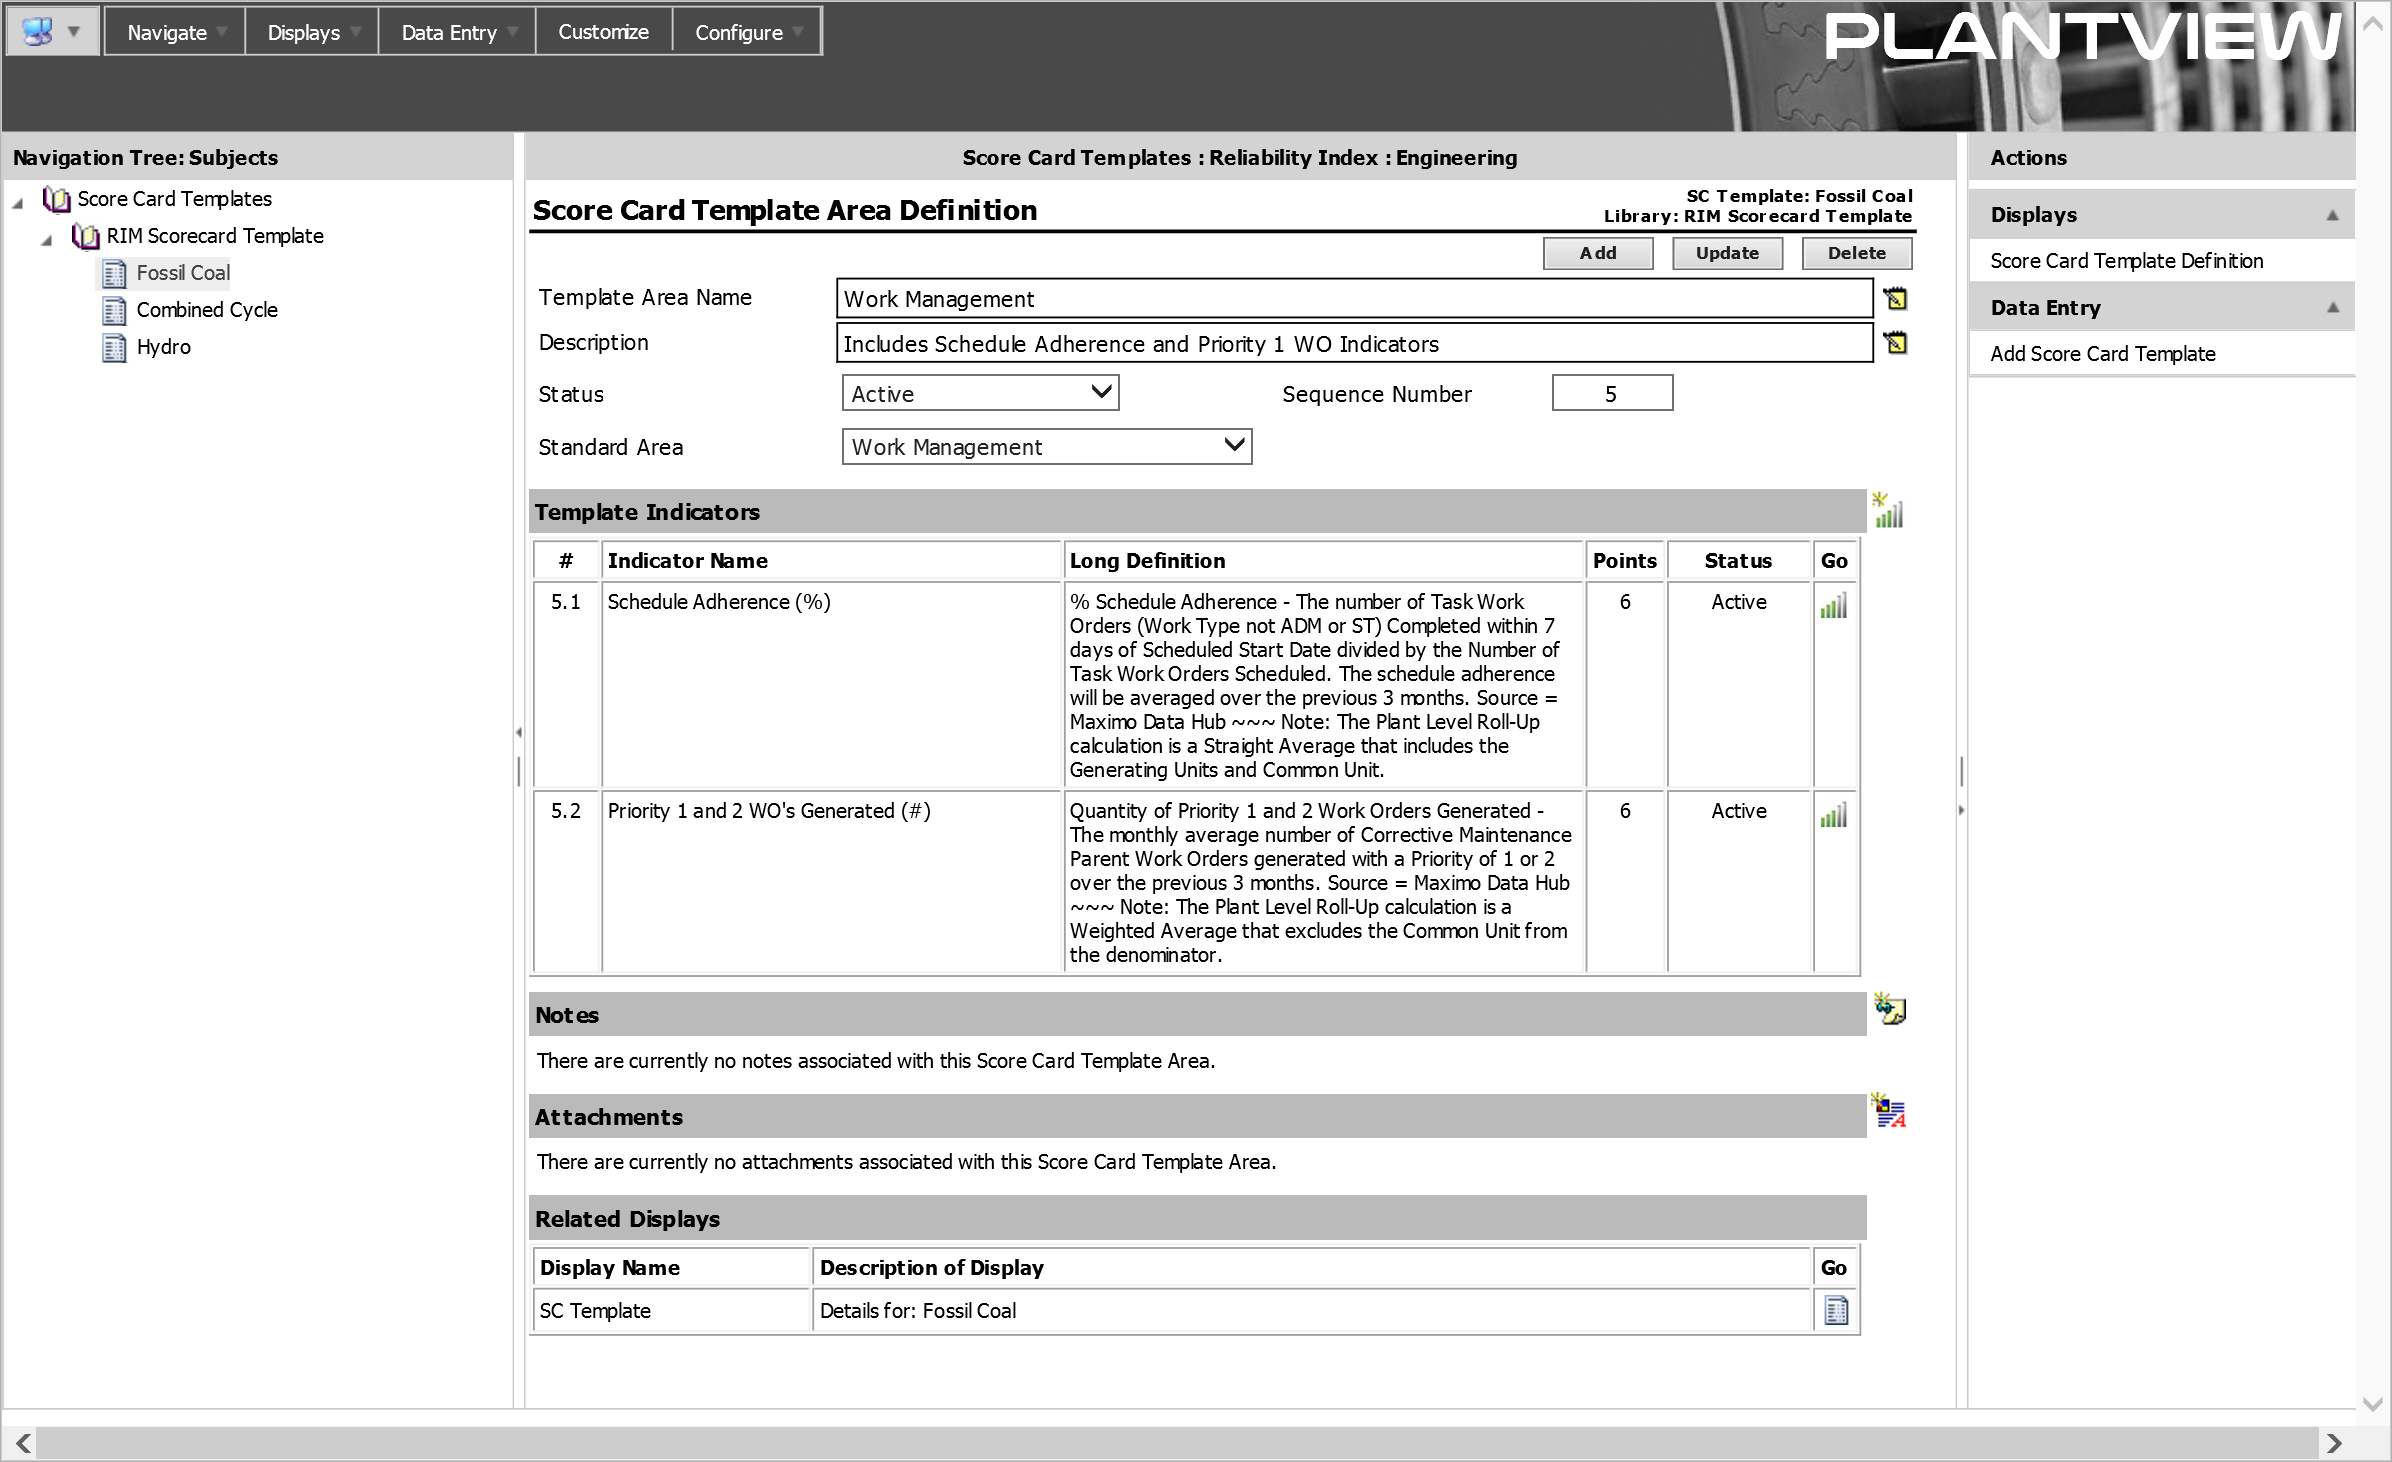
PlantView/RIM configuration is based on the premise that a group of equipment/facilities will implement an identical set of indicators and scoring rules. In RIM terminology, this identical set is called a Score Card Template. Each Score Card Template consists of multiple Areas such as Plant Operational Challenges, System Health, Maintenance and Work Management for which Indicators are defined representing the information that will be collected.
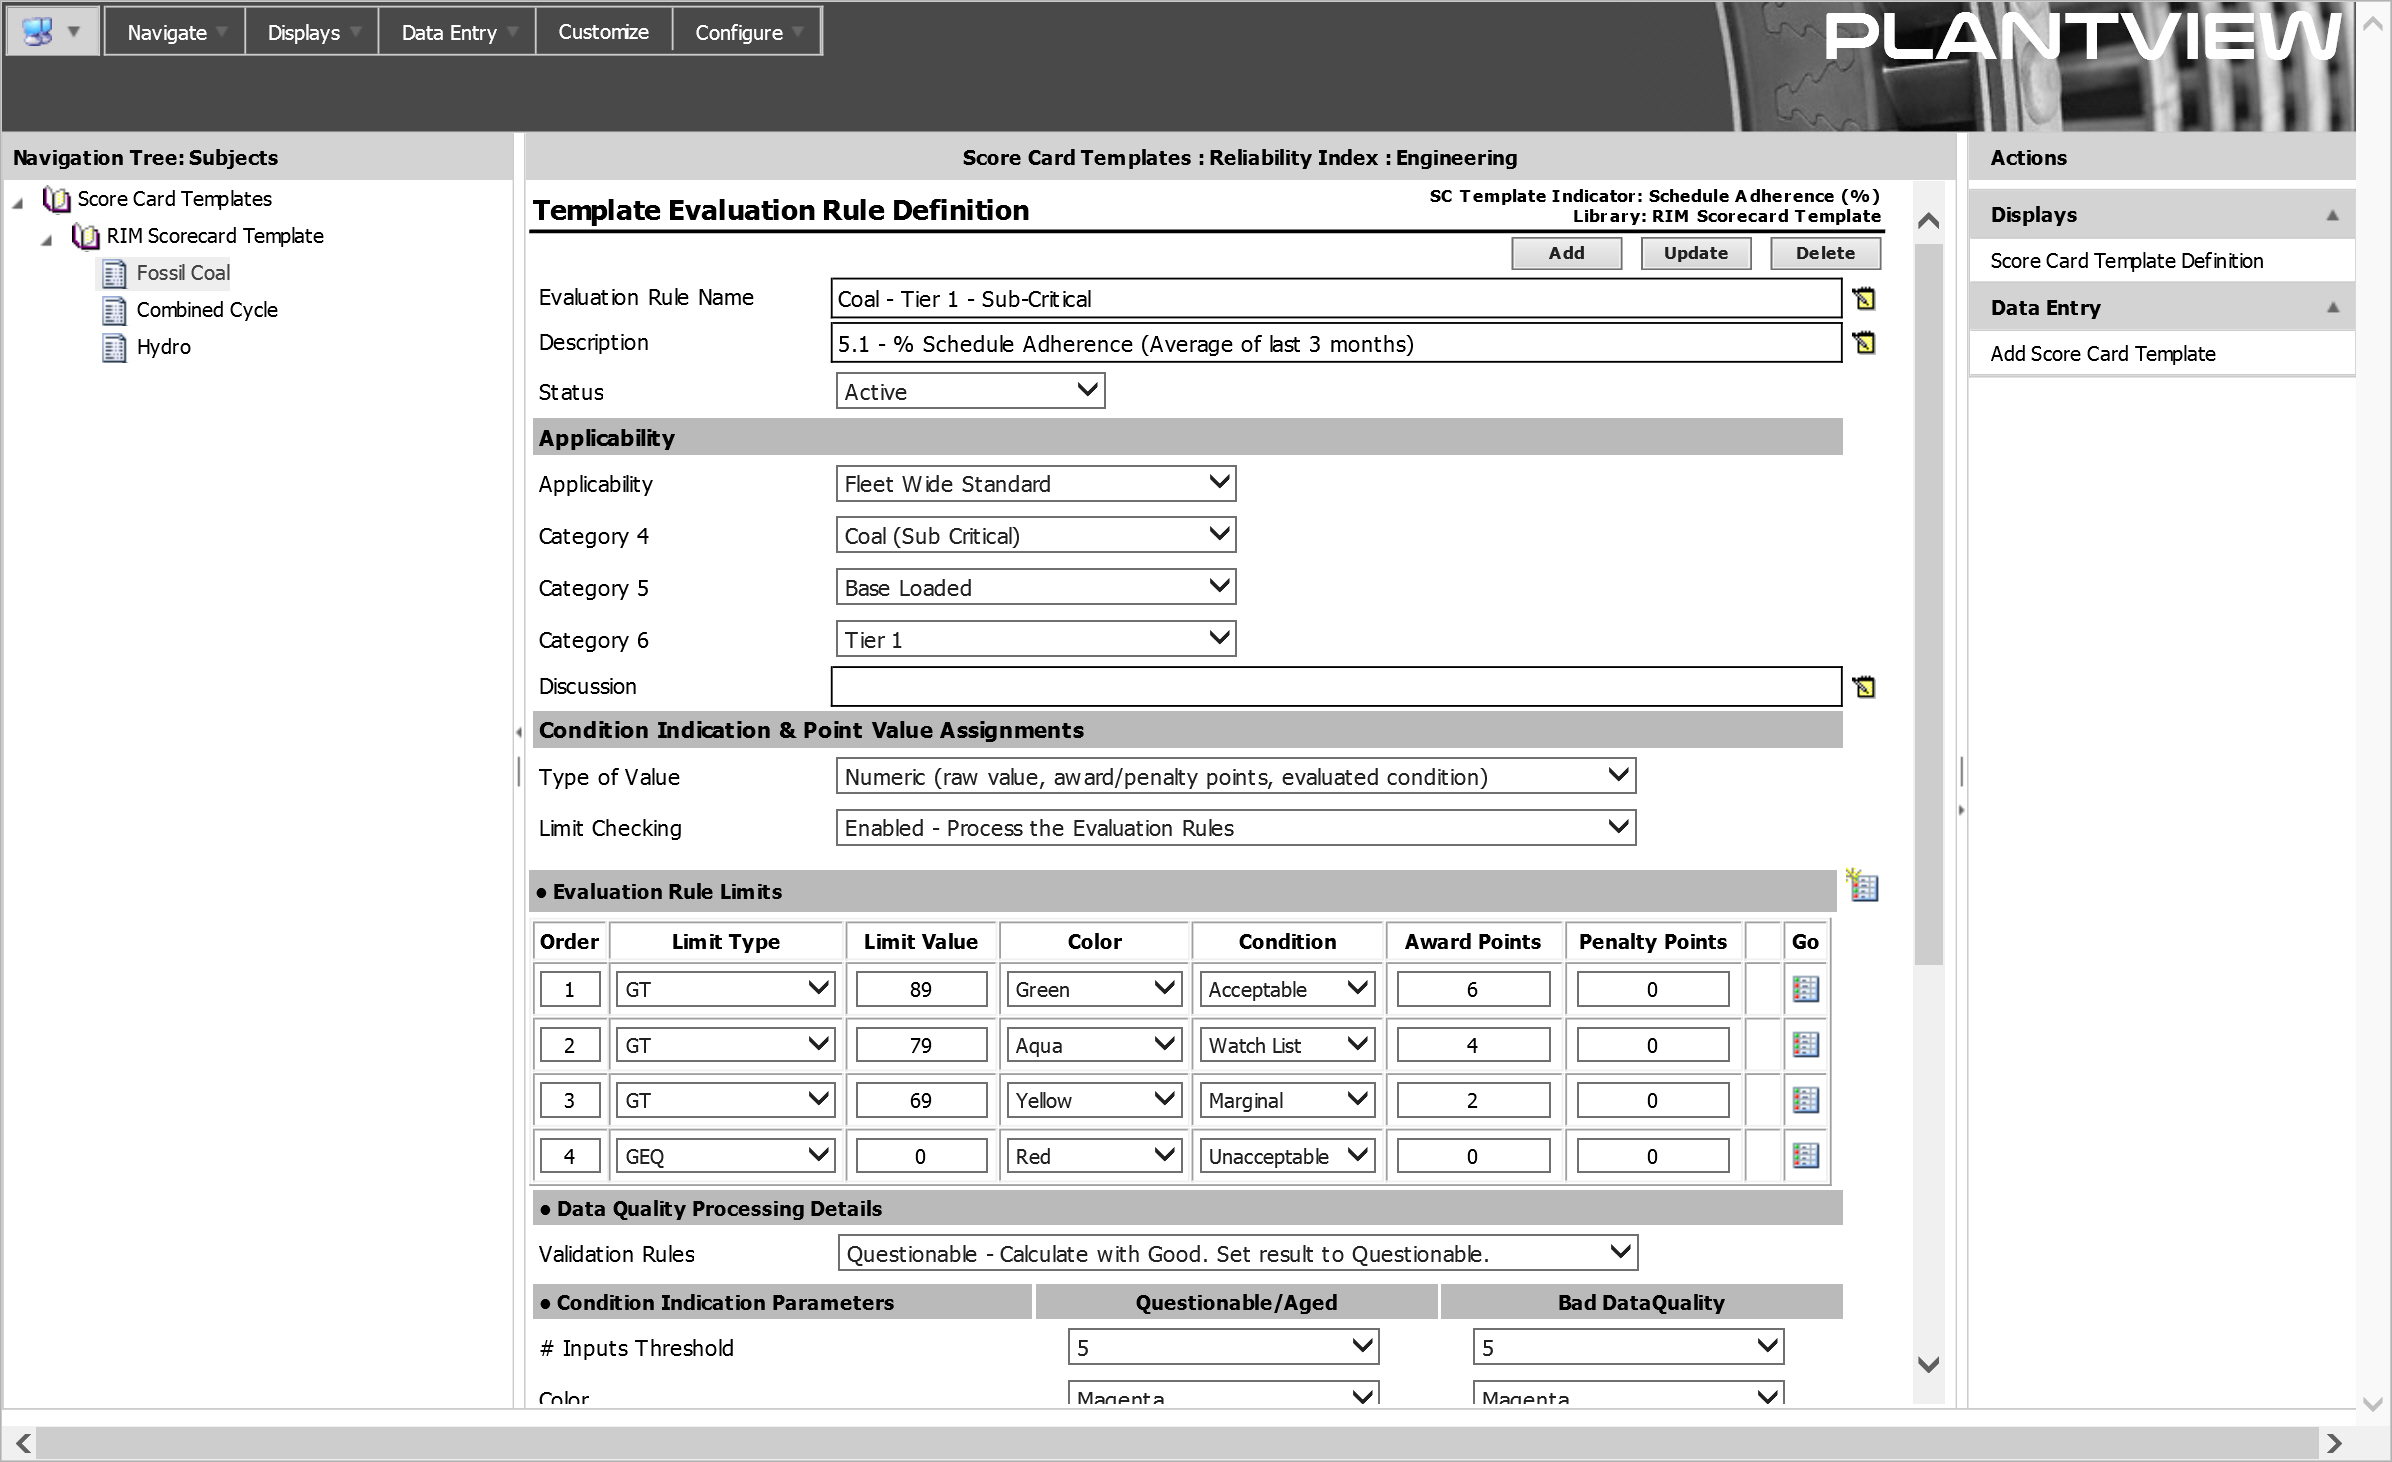
Evaluation Rules
Evaluation Rules associated with each indicator define the specific criteria that a value is measured against to determine award points and evaluated condition. Evaluation Rules allow the same Template to be used by equipment/facilities evaluated to different standards. Evaluation Rule Limits define the limit checks with their associated color, condition and award points.
Score Card
A Score Card represents the application of a generic Score Card Template to a specific equipment / facility. Each Score Card consists of multiple Score Card Indicators that link the indicators defined on the Score Card Template with SQL or Calculated Data Points that provide the required information for the specific unit. Score Cards are calculated on a continuous, daily or monthly basis with the results available in several views (displays). It is possible to view the definition of an indicator and its scoring criteria directly on the Score Card form.
PlantView/RIM in Action
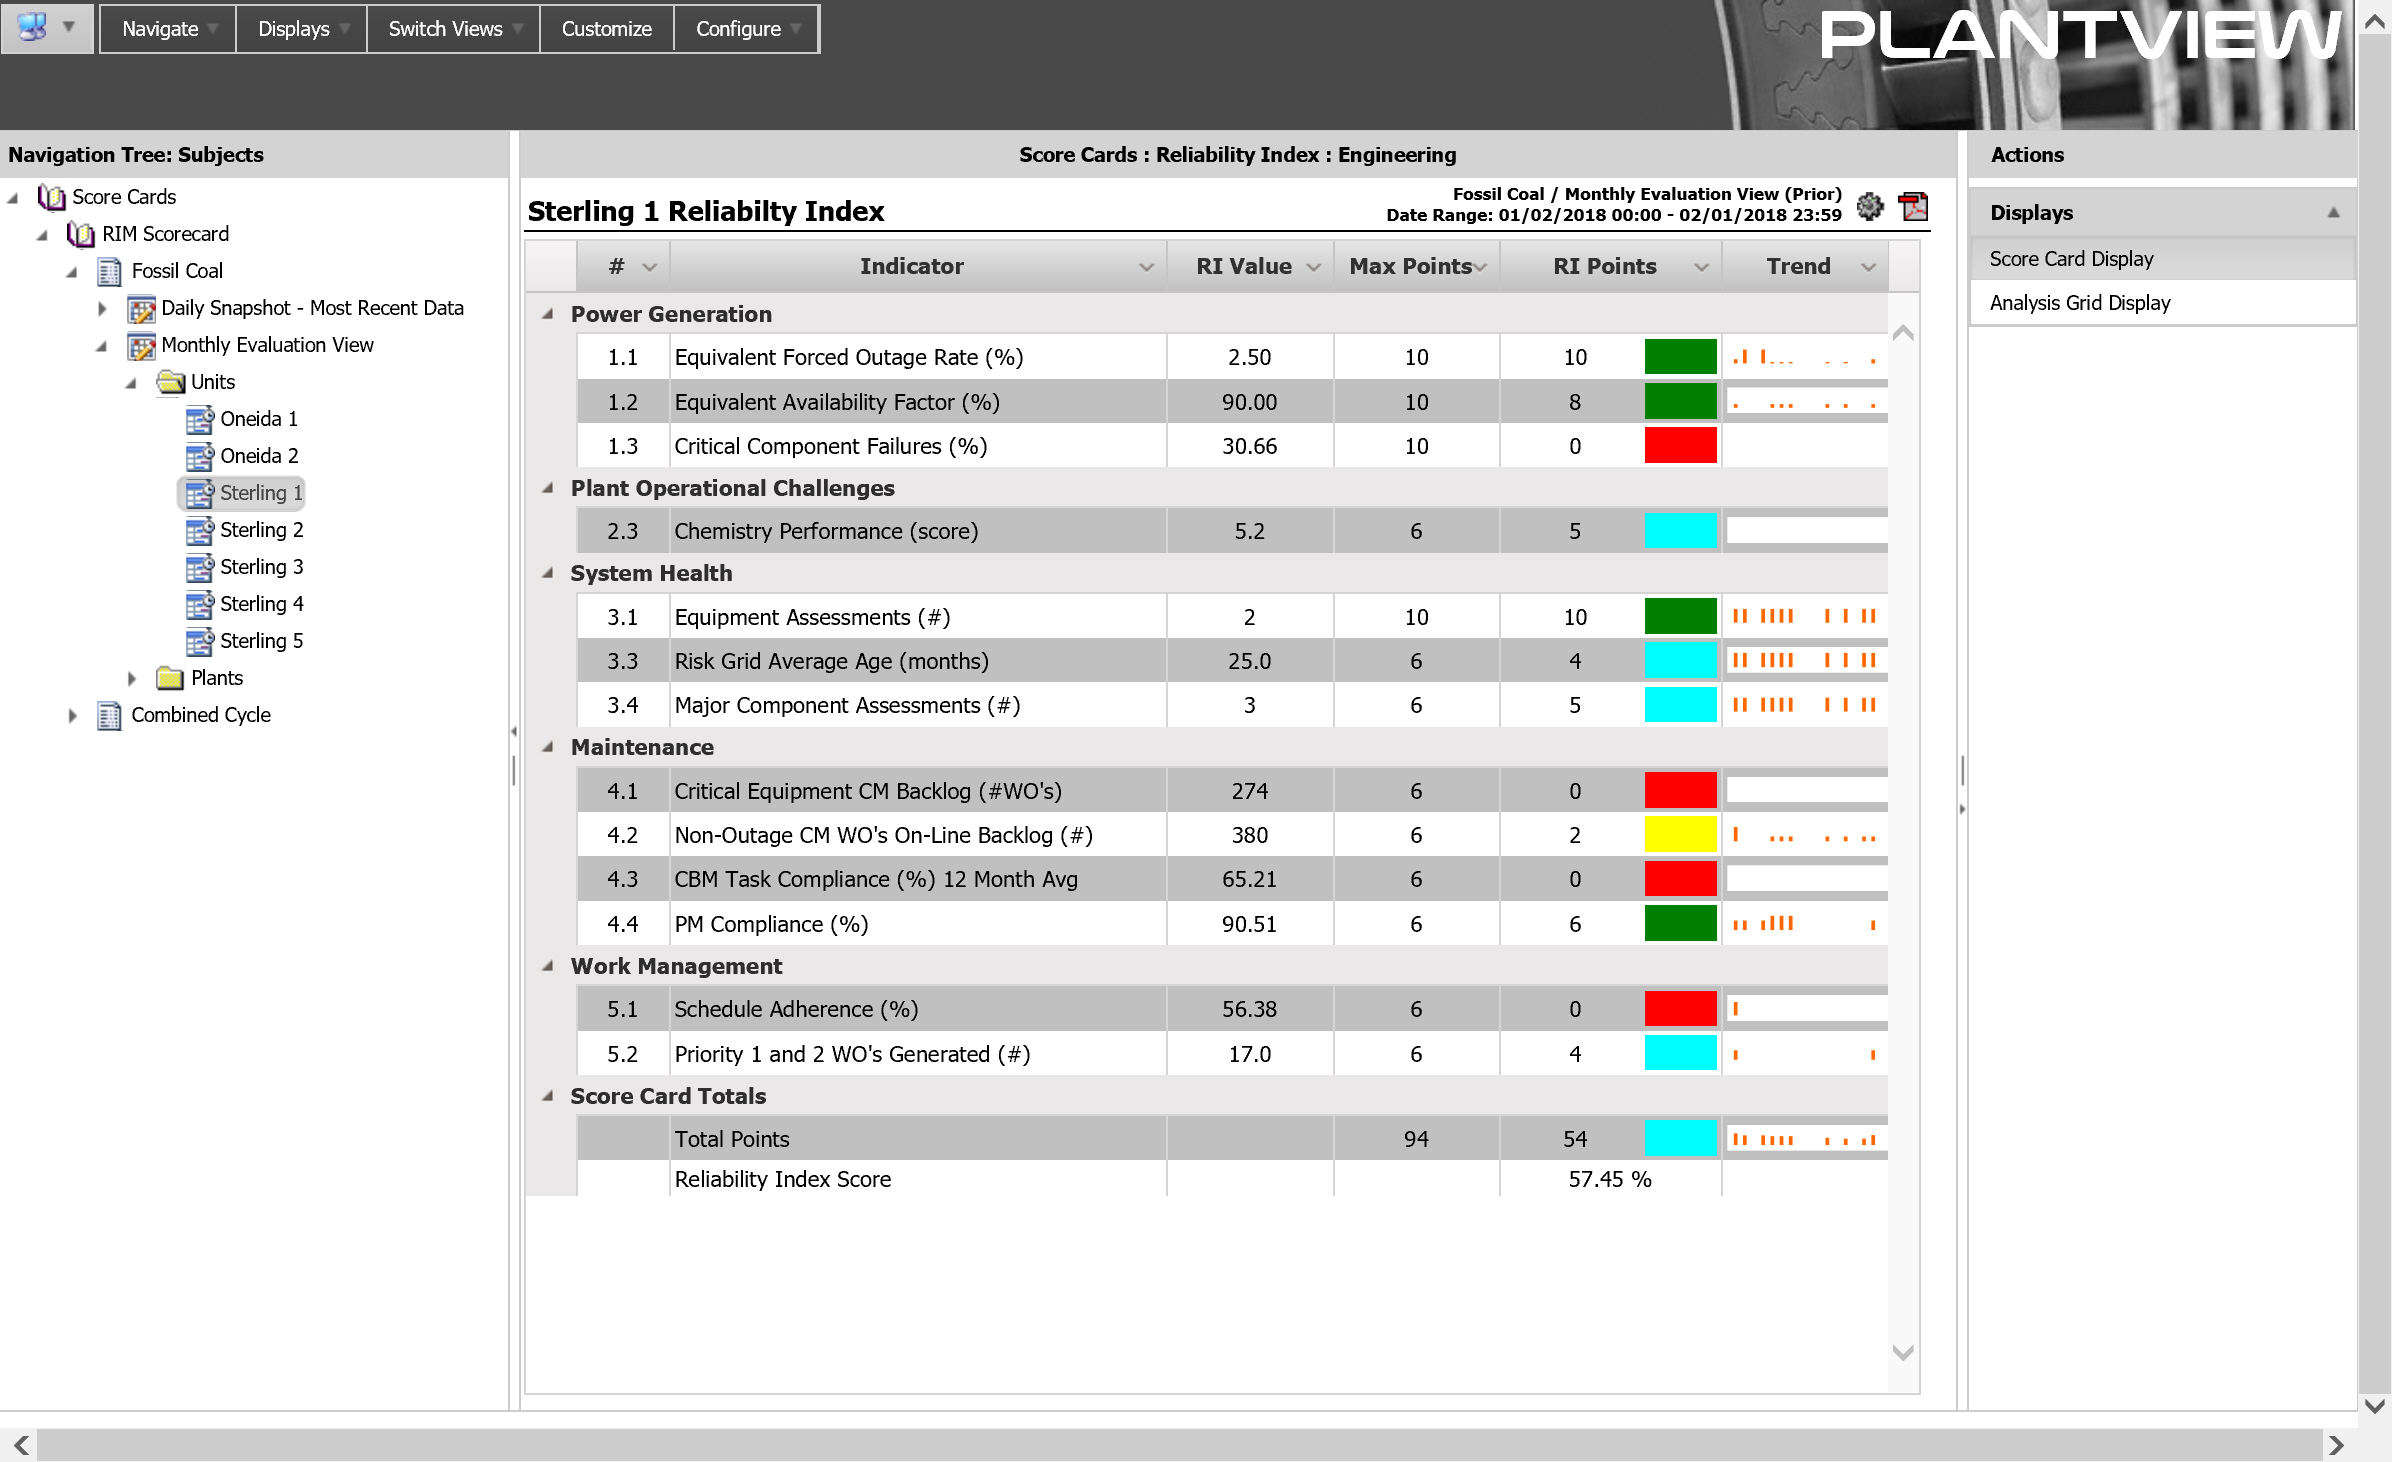
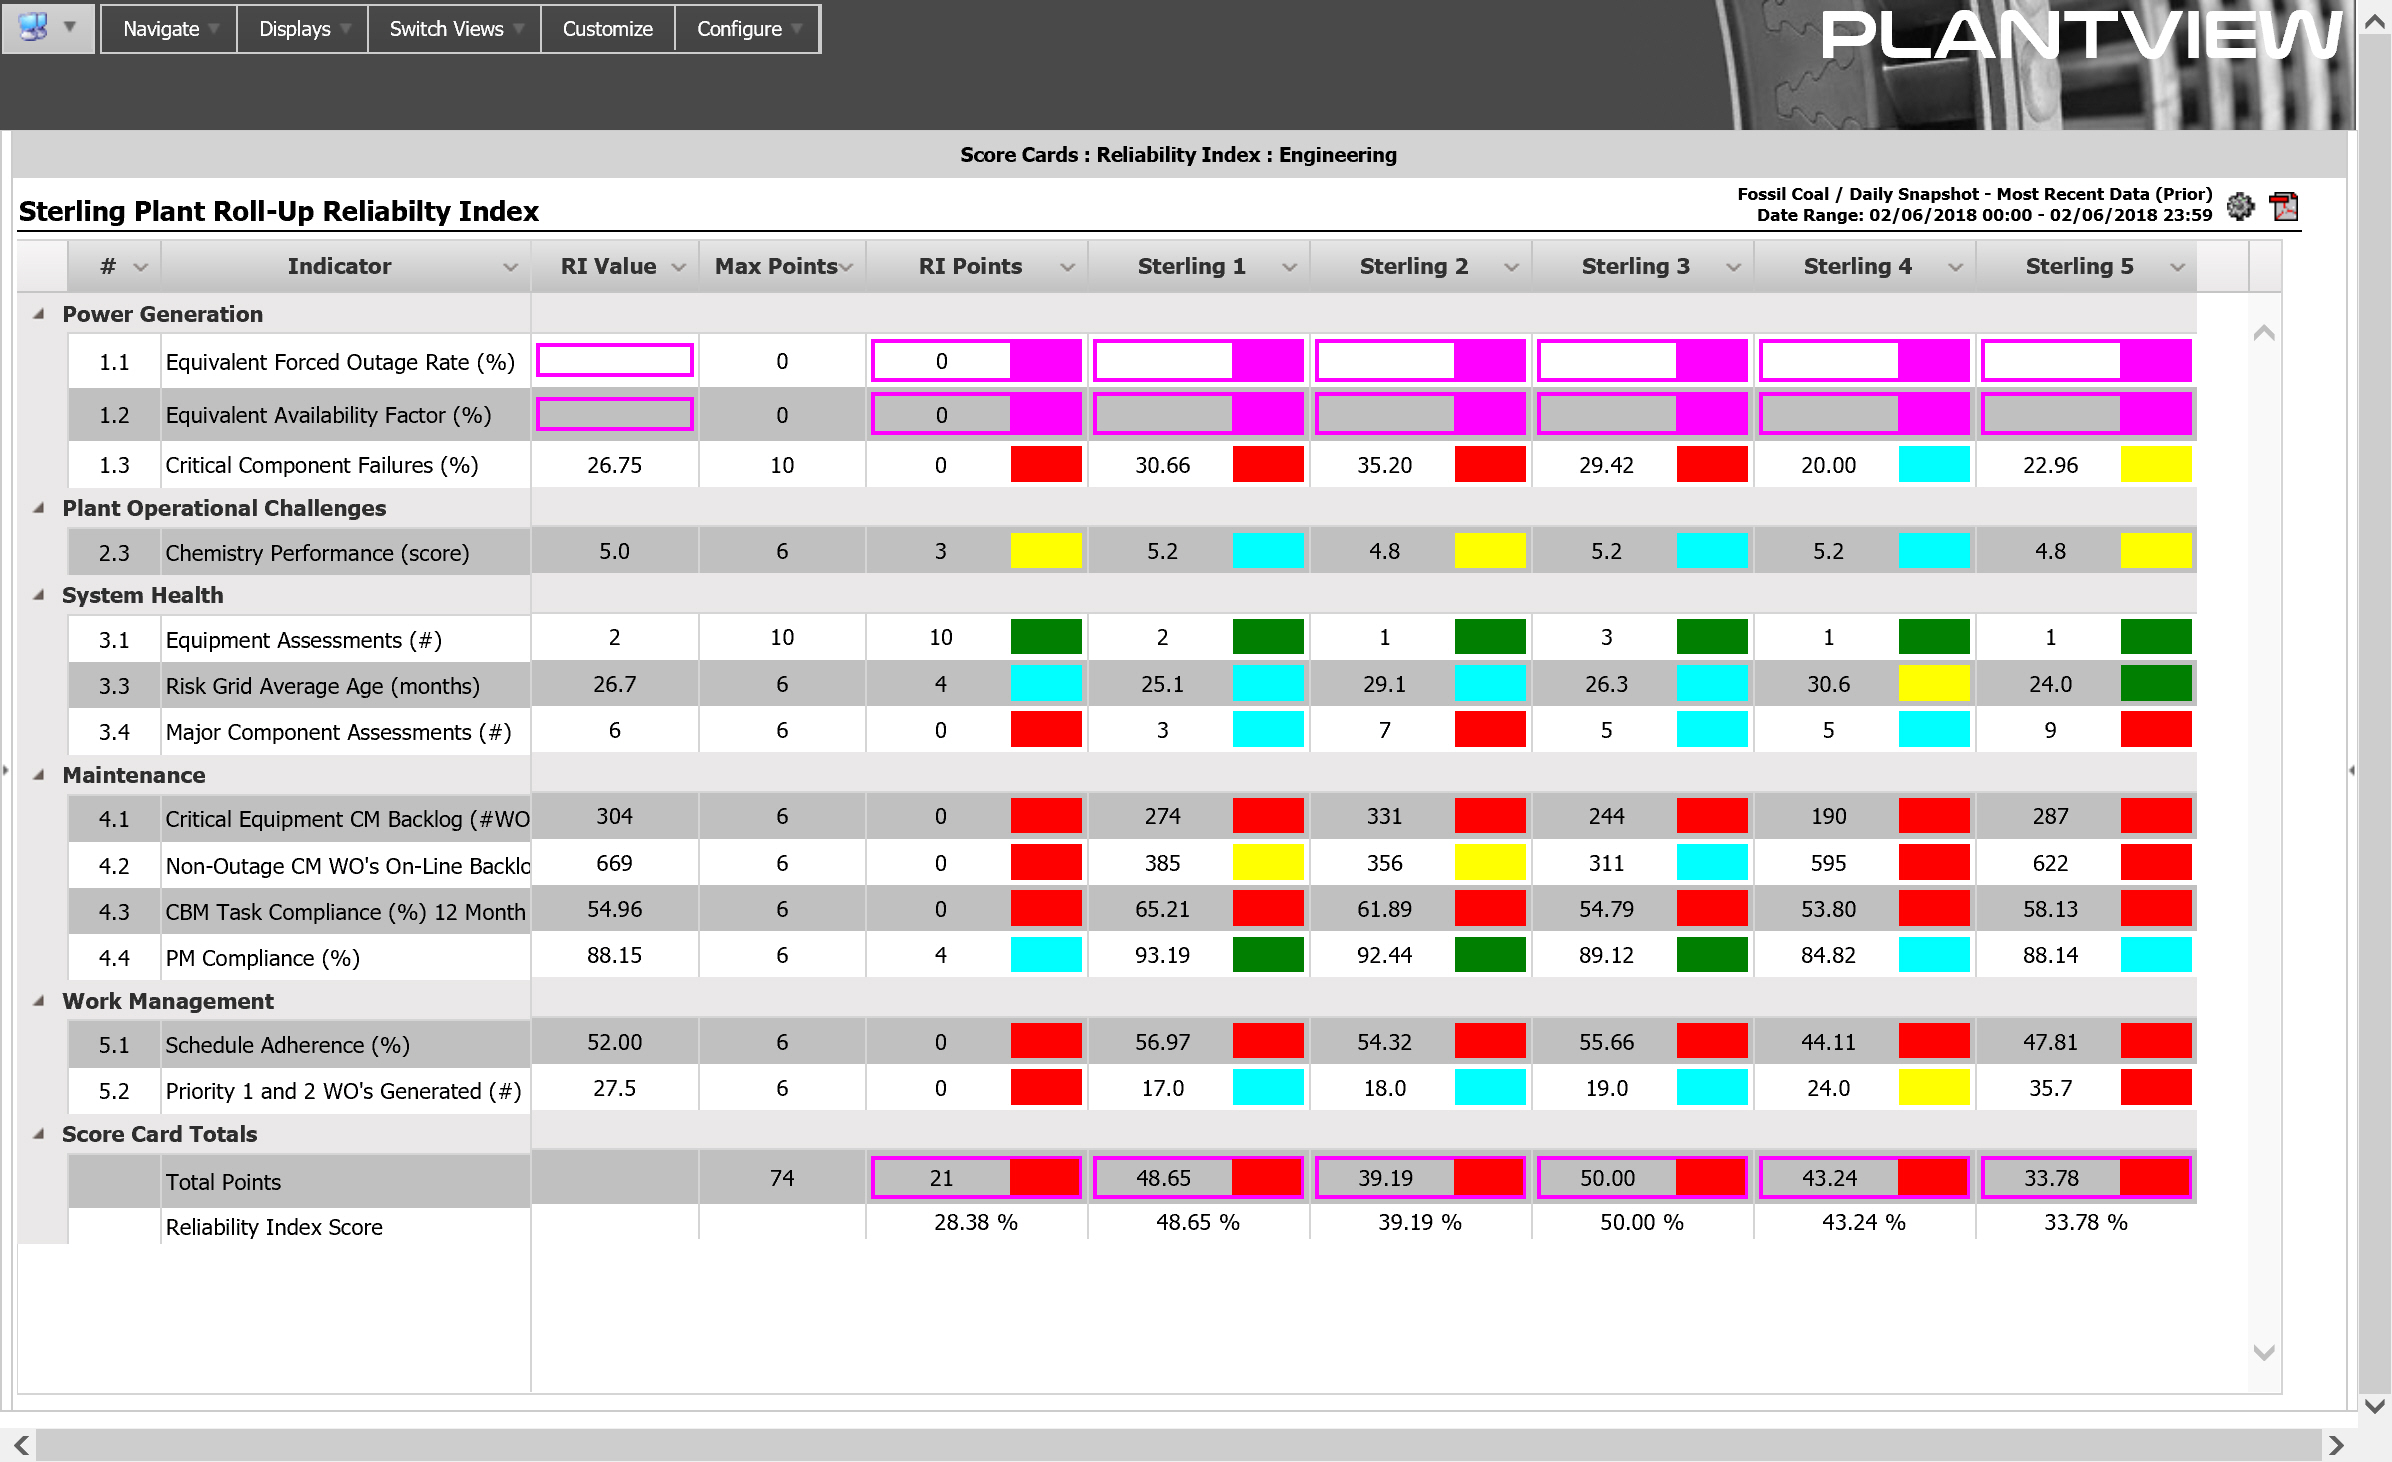
Each key process or program owner is normally assigned responsibility for an indicator(s). These stakeholders access the Score Cards to monitor up-to-date values and scores for their indicators at the facilities for which they are responsible. If an indicator reflects unsatisfactory performance, RIM displays would allow that owner to investigate the “whys” of the negative performance and implement the appropriate corrective actions. The Score Card View offers the most detailed view of Reliability Index information. There are five (5) columns of data: value of the indicator, points awarded, maximum number of points available, evaluated color and a sparkline showing the change in evaluated points.
The Analysis Grid View offers a condensed view of Reliability Index information within a single cell. The displayed value and background color of a grid cell is configurable. For items implementing the same Score Card Template, adhoc versions of several views are provided to facilitate comparing Reliability Index performance between different selections that would not be possible with the standard hierarchy of equipment/facilities.
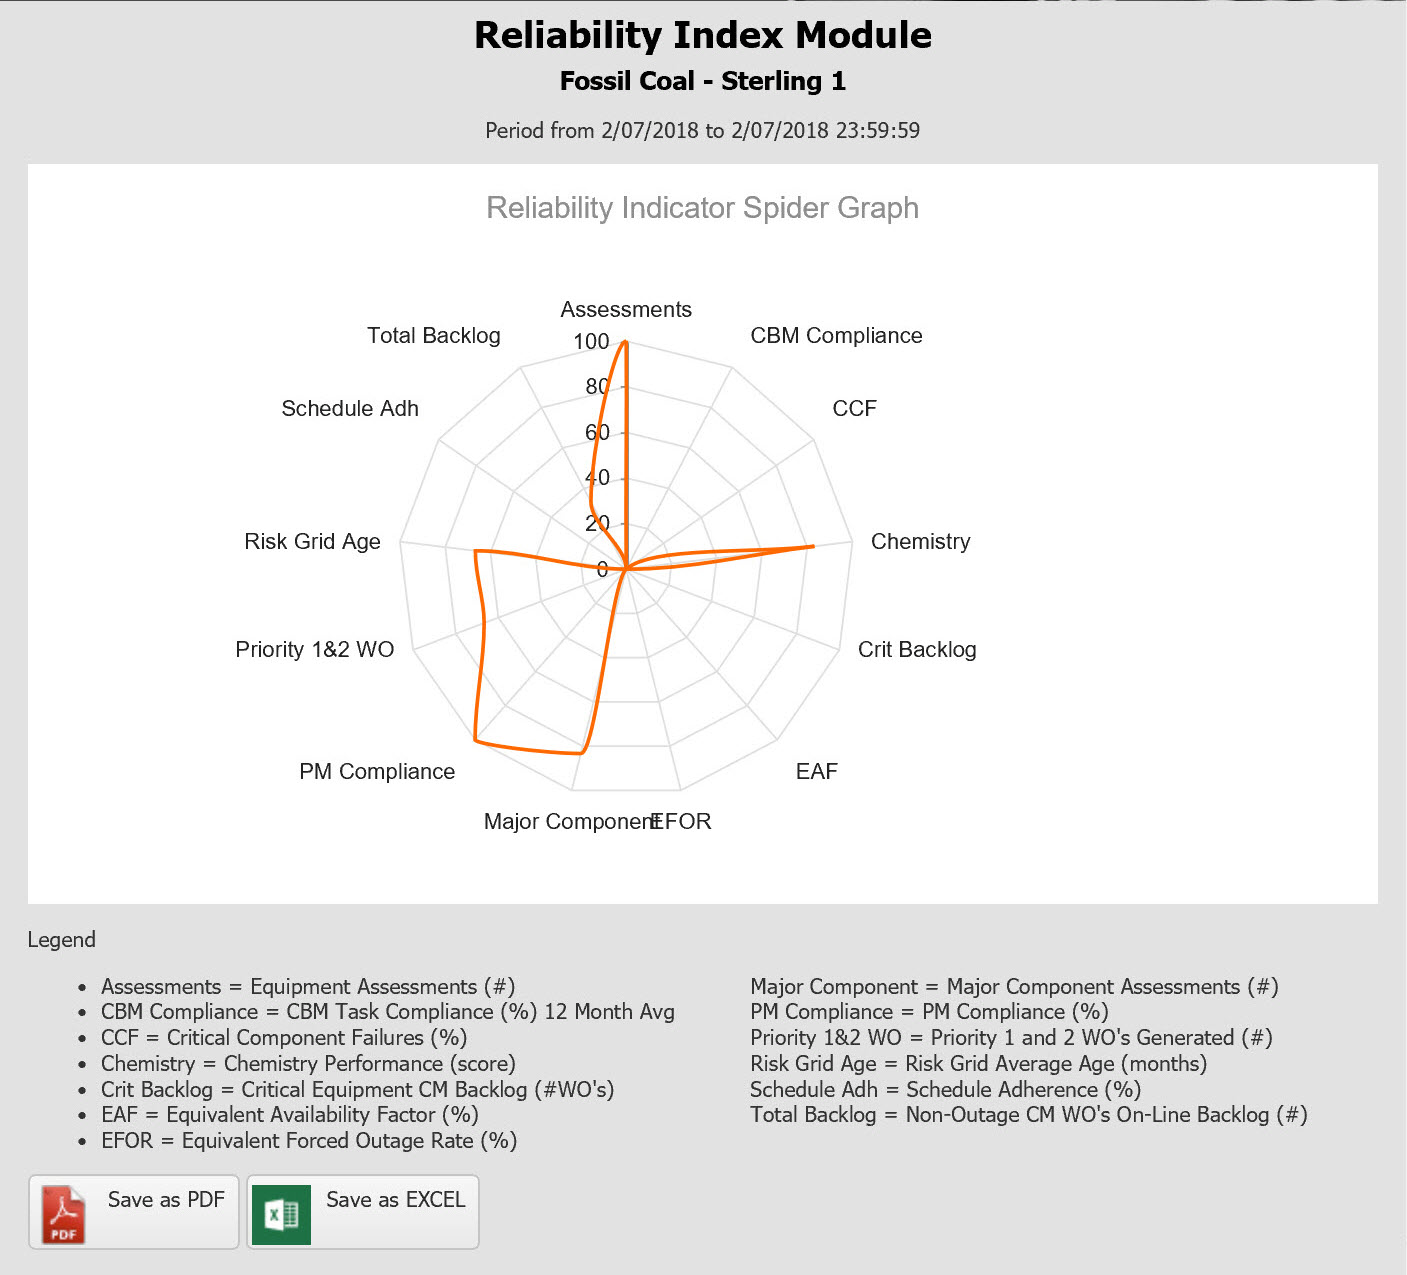
In addition to the tabular displays, there are several graphical views. The Spider Chart or Radar Chart view is used to compare a selected set of equipment/facilities in graphical format.
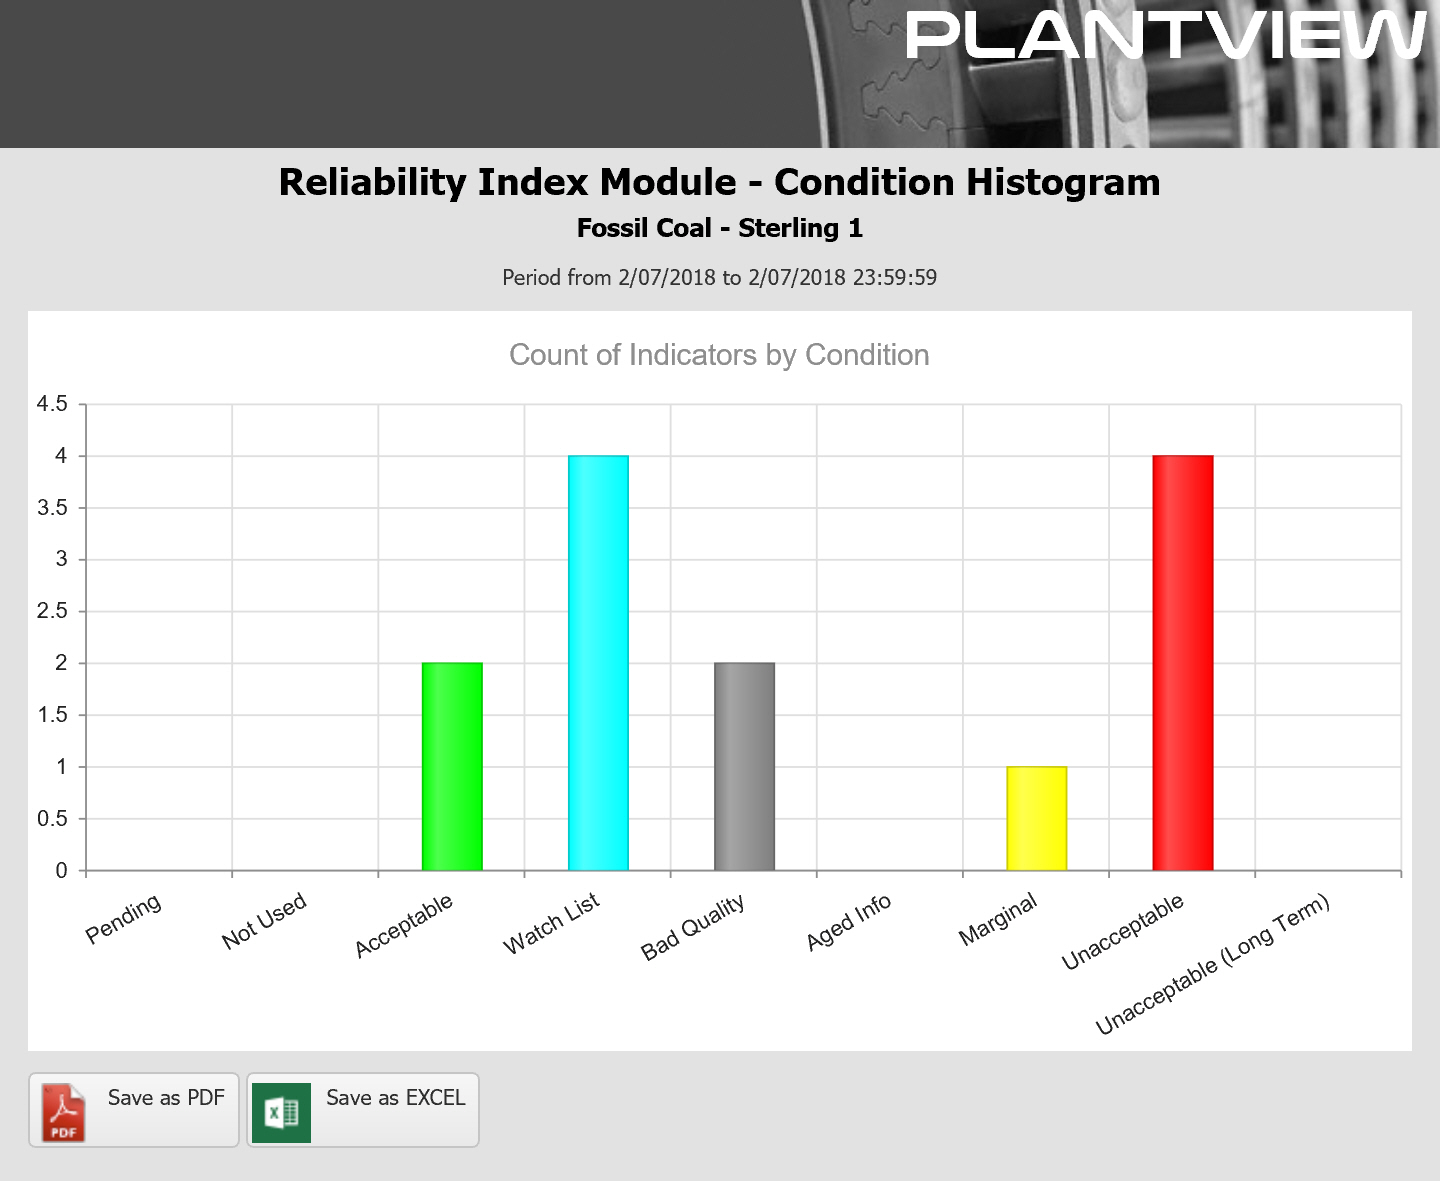
A Pareto Chart or Histogram view is a bar chart – with a bar for each condition code (Unacceptable, Marginal, Watch List, Acceptable) with the height of the bar being driven by the number of equipment/facilities in each condition. A typical display would be a histogram distribution of all facilities indicating how many have current indicator result condition codes that are red, yellow, cyan and green.
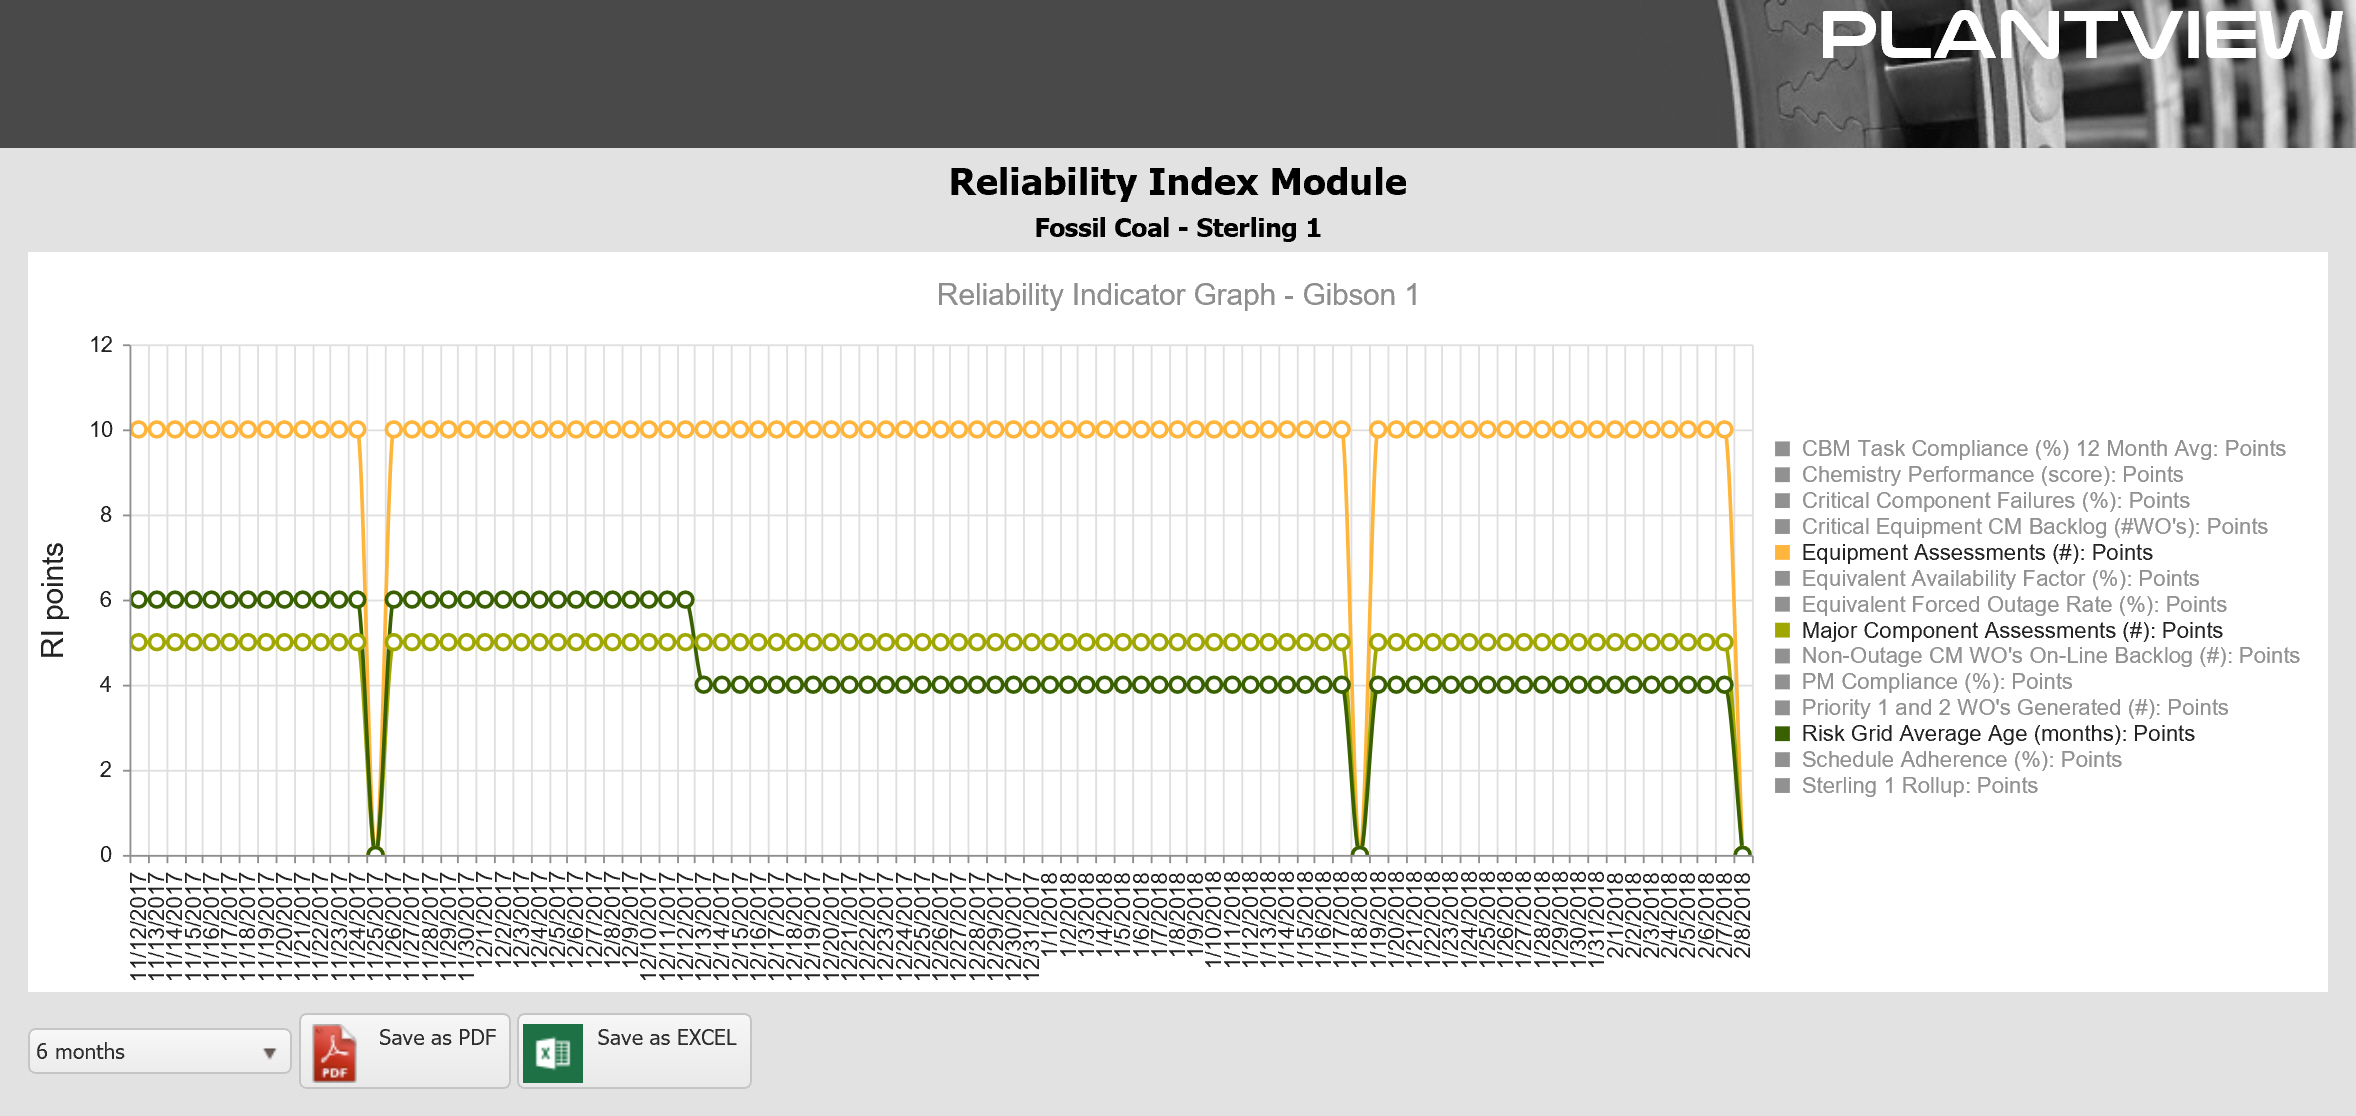
The Trend Chartview is used to plot a given Score Card result, Indicator Result score or value over a configurable period of time. It is available to display all indicators for a single unit or to display a single indicator across multiple units or facilities. Each of the graphical views supports exporting the underlying data to Excel or the currently displayed view to a PDF document.